In the last article about the PCM5122 Audio DACs, we went over how to use the Bill of Materials tool on the MacroFab website to price out our production run and influence the choice of our parts. This resulted in three different passive part loadouts of the Audio DAC with varying costs between them.
To figure out which DAC setup performs the best, I needed to do some bench measurements and then a blind listening test with people here at MacroFab. You can also find out more about the test and other problems with the prototypes by listening to the MacroFab Electronics Podcast EP#108: Crazy Transistor Contraptions.
A quick recap of the differences between the three DAC passive part loadouts:
-
DAC A
- Audio grade parts for bypass power supply filtering
- Audio grade parts in the audio signal path
-
DAC B
- C0G (NP0) dielectric ceramic caps for bypass power supply filtering
- Audio grade parts in the audio signal path
-
DAC C
- C0G (NP0) dielectric ceramic caps for bypass power supply filtering
- Inexpensive thick film resistors and C0G (NP0) dielectric ceramic caps in the audio signal path
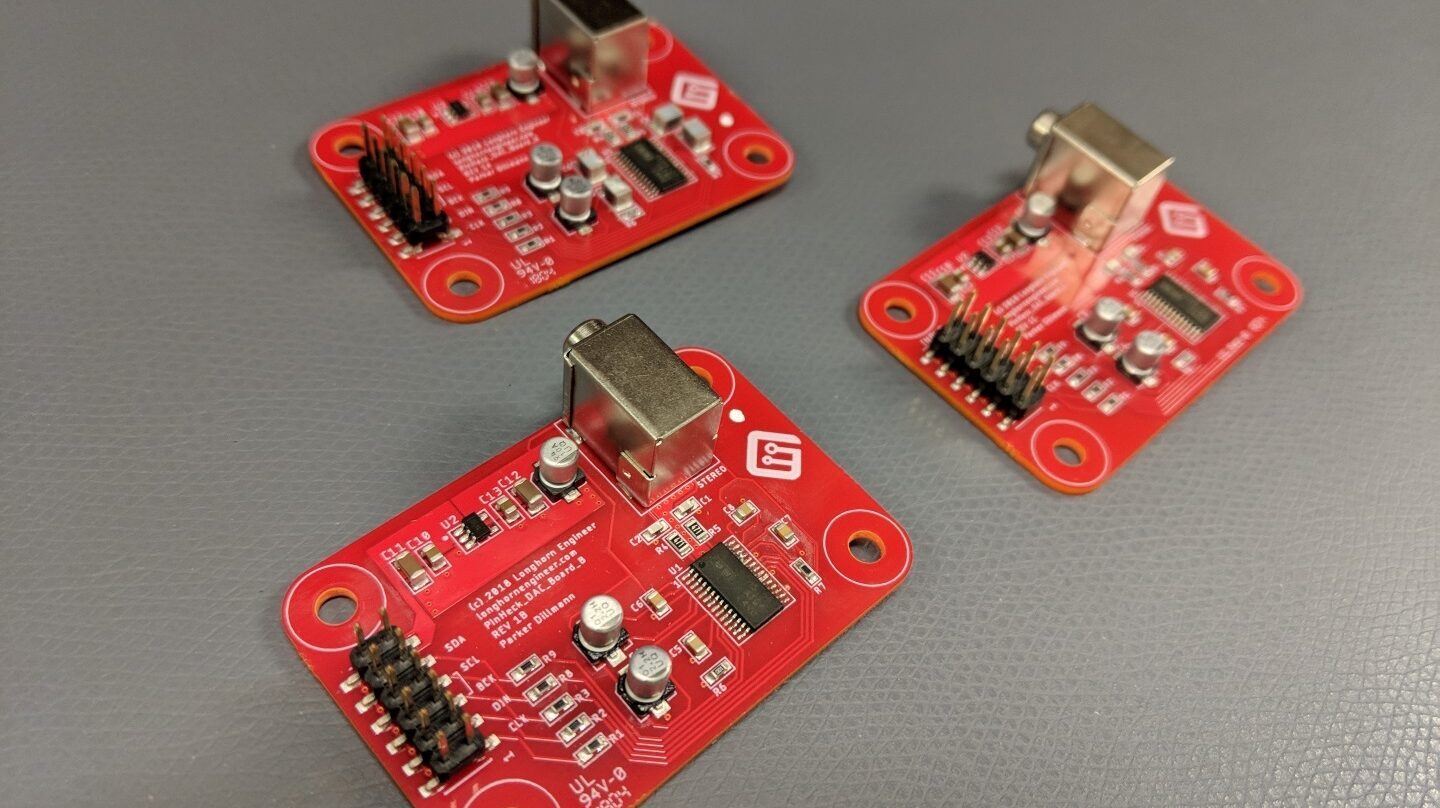
The three Audio DAC boards. Each board has a different loadout of passive components surround the PCM5122 I2S Audio DAC. Will there be a difference in Perceived Audio Quality and can we measure a difference?
DAC Test Setup
For an Audio source I set up a Raspberry Pi with Audacity and generated a 1kHz sine wave for testing a single frequency and then a 10Hz to 20kHz sweep to test the frequency response over the entire audible range. You can download the audio waveforms I generated below.
1kHz Sine Wave
10Hz to 20kHz Sweep
I then hooked up the DACs with jumper wires to the raspberry pi using this diagram I found on the raspberry pi forums. Since the PCM5122 is used on the HiFiBerry DAC+ I was able to get the DAC running with minimal edits to the config.txt file. I just added the following lines to the /boot/config.txt file.
dtparam=i2s=on
dtoverlay=hifiberry-dacplus
For measuring the output of the DACs I used a OWON DS8302 oscilloscope and the line input on my computer’s sound card. Depending on how the DAC is impedance matched, its signals could change. The oscilloscope should act pretty much like an open load and the line input on the sound card should be closer to an input of a amplifier which the DAC is designed to drive. The oscilloscope is also at best 10bit resolution where as the sound card is 32bits.
Oscilloscope Results
With the Oscilloscope I only ran the 1kHz sine wave. I then ran a FFT on it using the built in math function the oscilloscope had. I set the scope to be bandwidth limited to 20MHz. First I wanted to look to see if the wave forms look good and if there was anything noticeable in the sine wave.
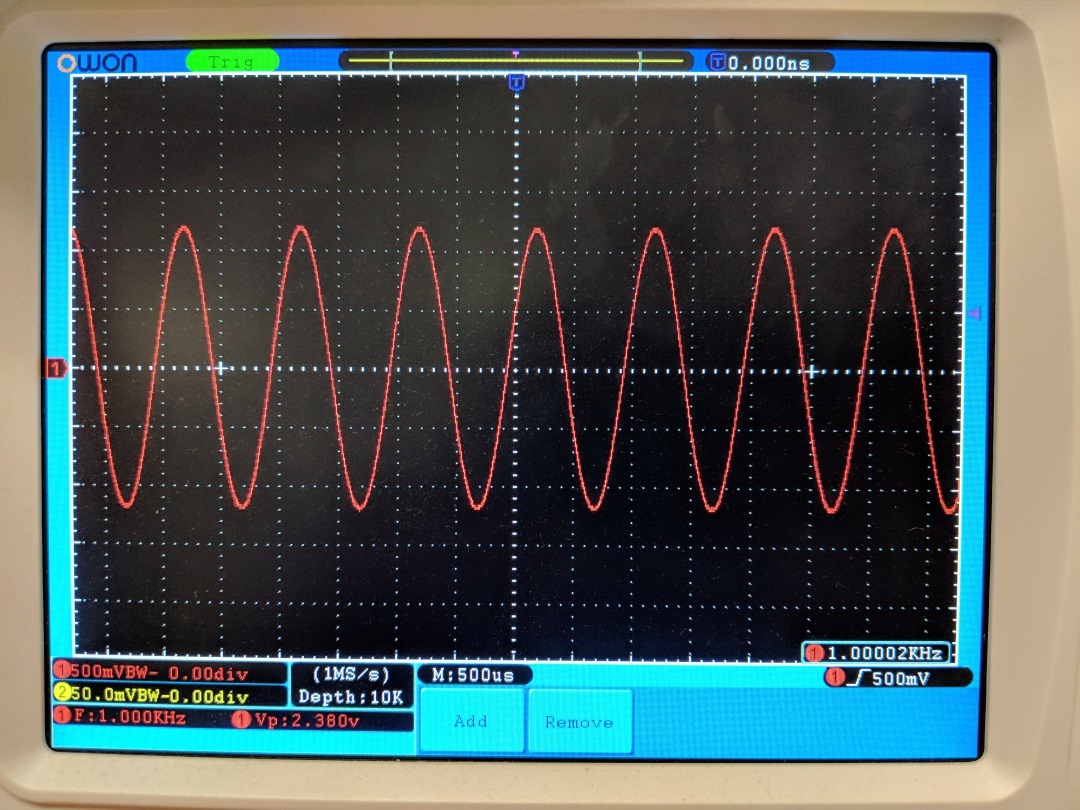
Audio DAC A with a 1kHz sine wave
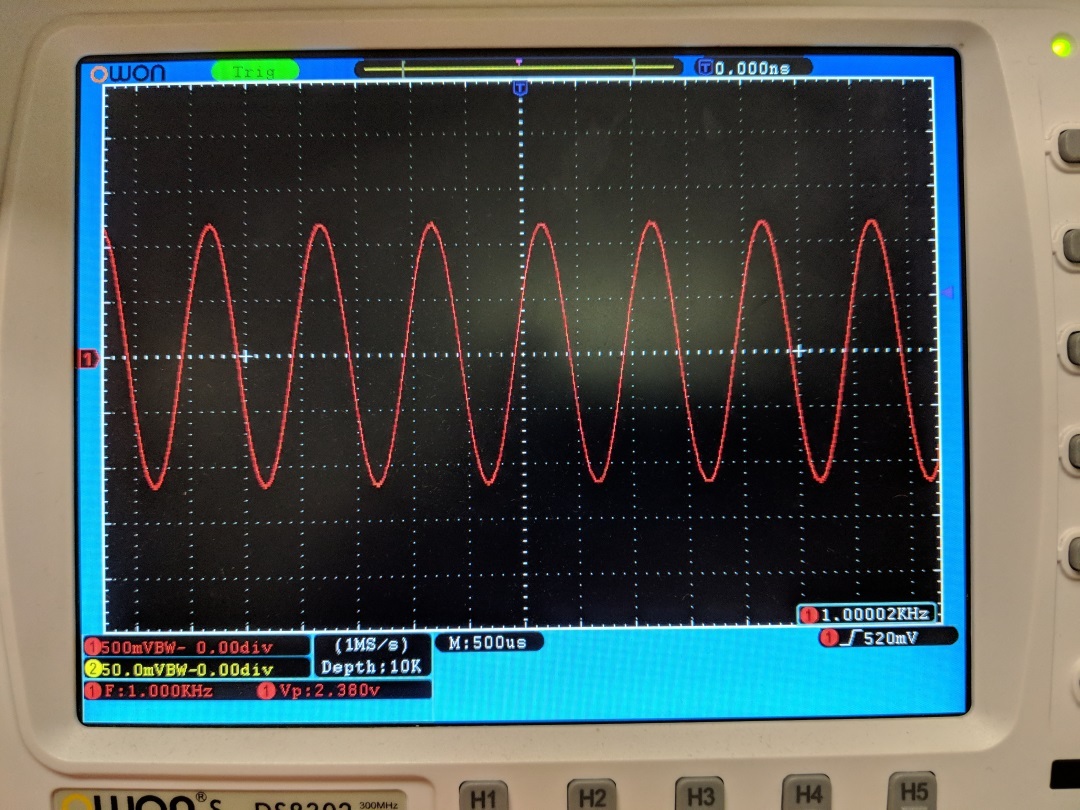
Audio DAC B with a 1kHz sine wave
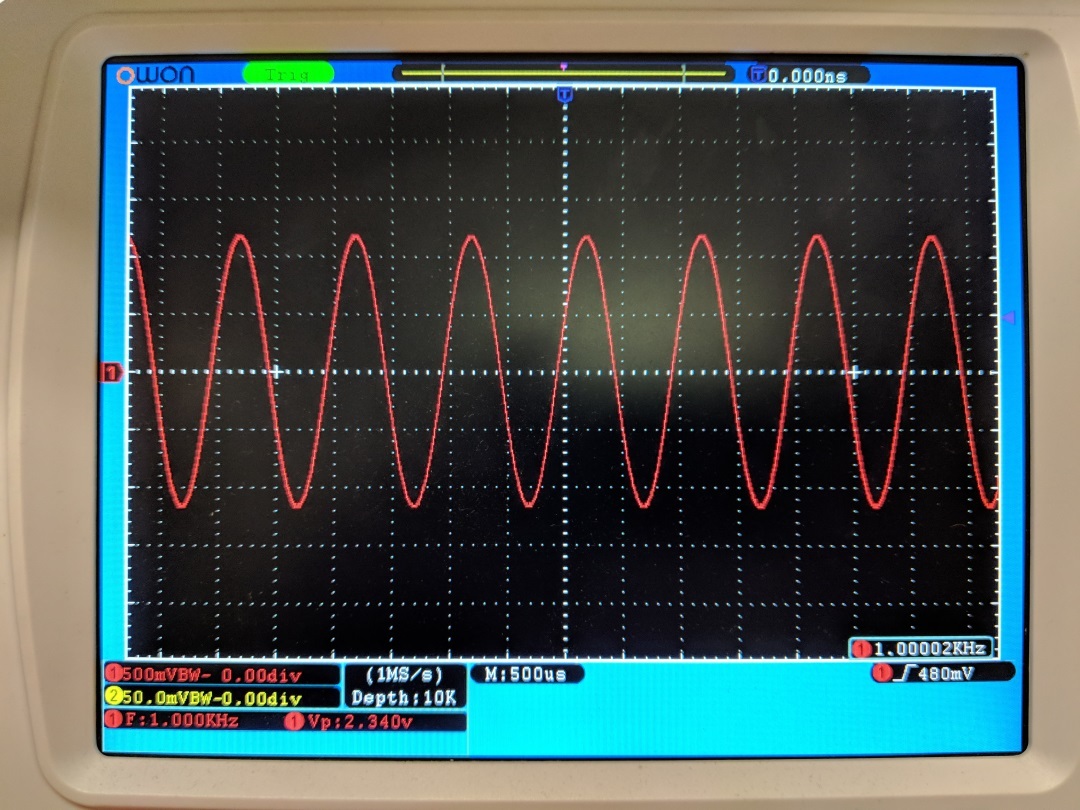
Audio DAC C with a 1kHz sine wave
Nothing notable between the three DACs here with the exception that DAC C has a slightly lower Peak Voltage of 2.34V verse 2.38V. Could this be caused by the tolerance specification different in the output resistors? I measured the resistor values and they read 470ohms on the meter so it might be with how the two resistor types (thin film / thick film) react to AC signals. Thin film resistors react better to high frequencies as they typically have less capacitance and inductance compared to thick film resistors.
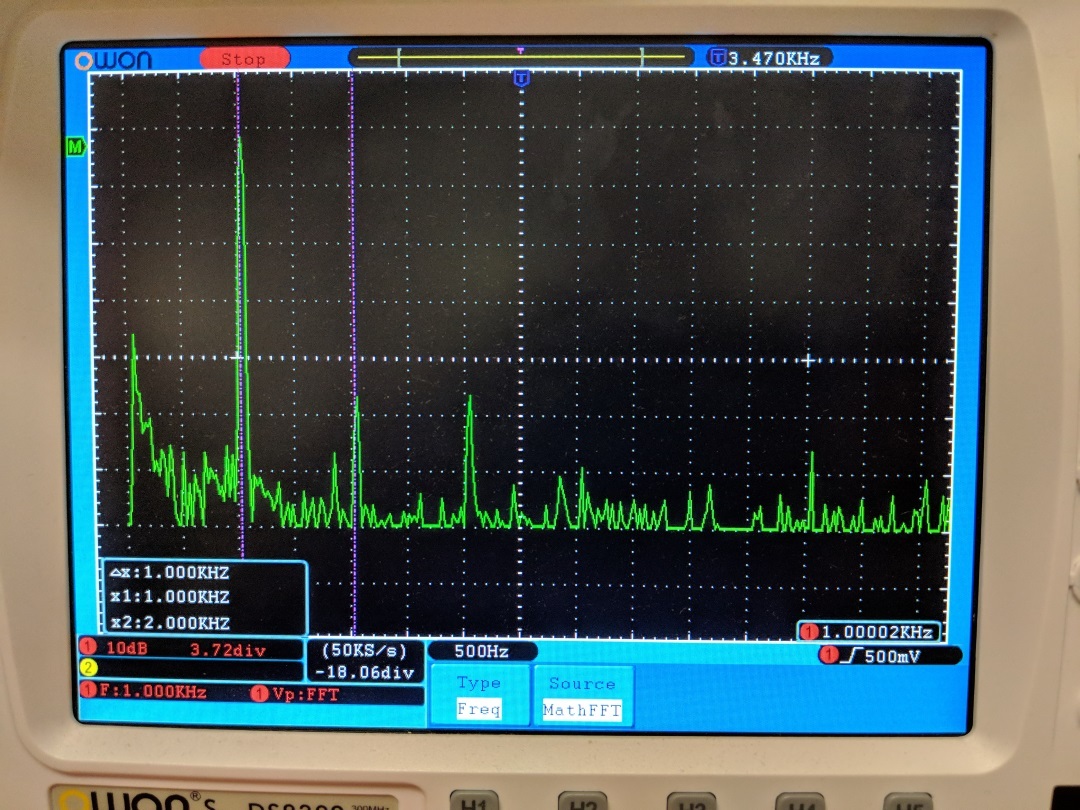
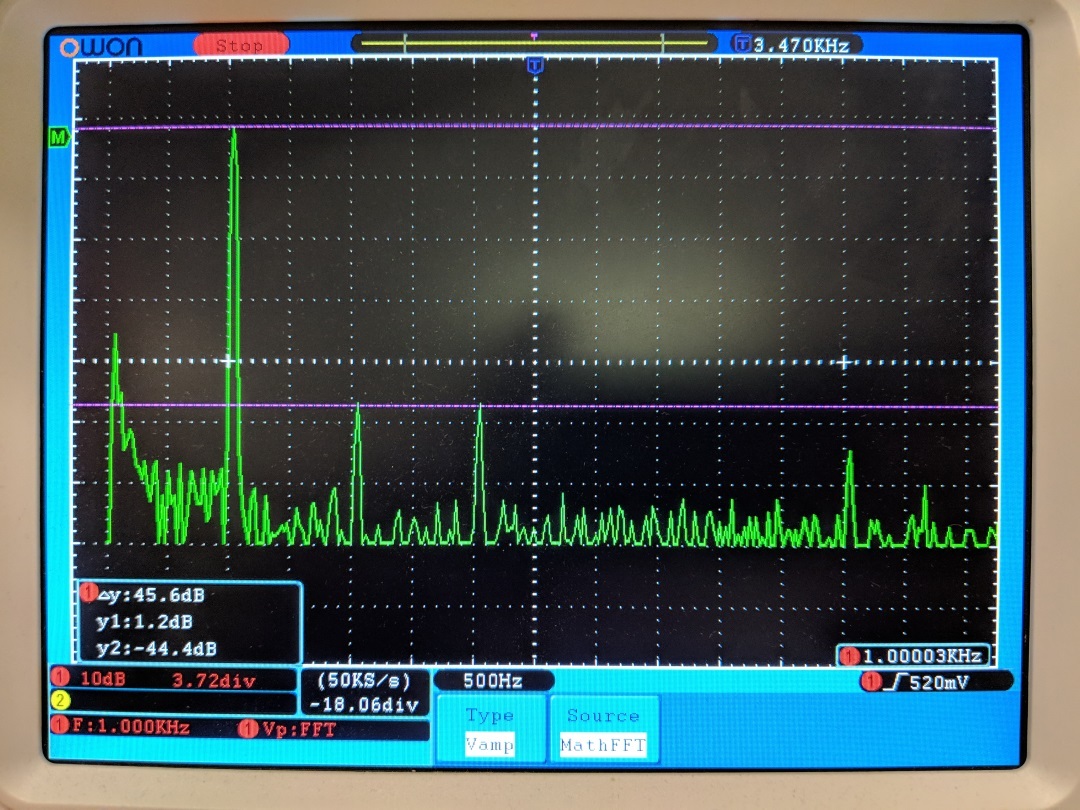
Audio DAC A FFT of the 1kHz sine wave
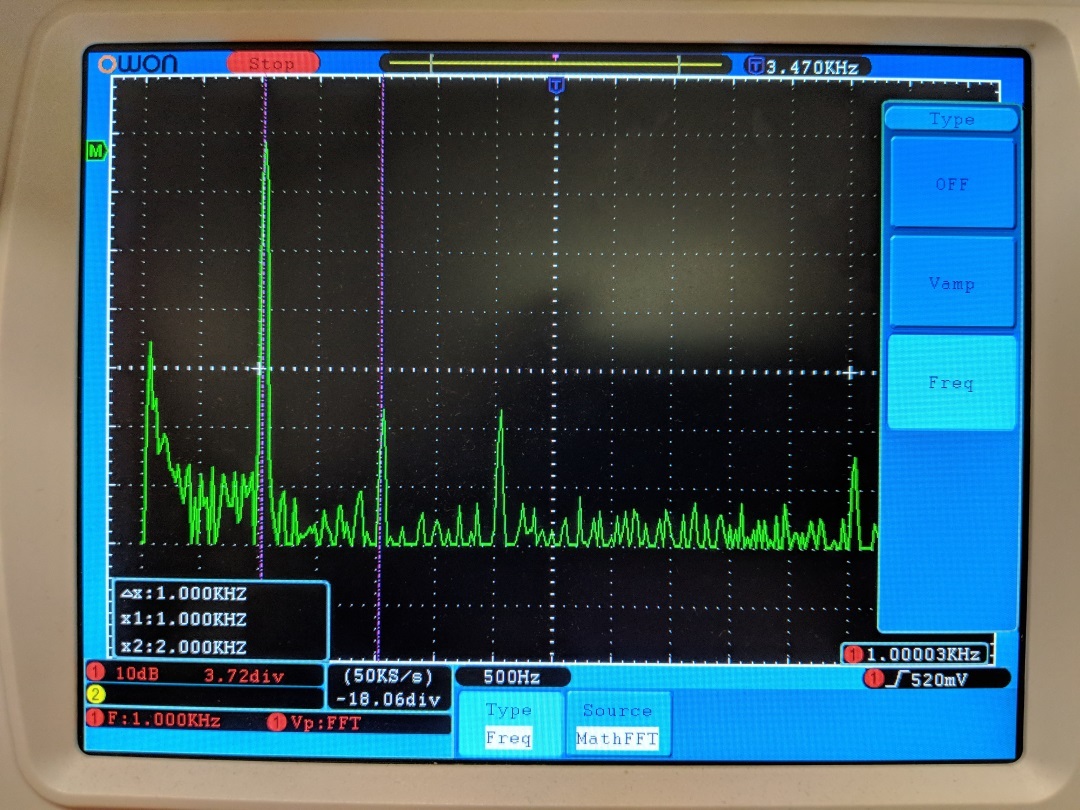
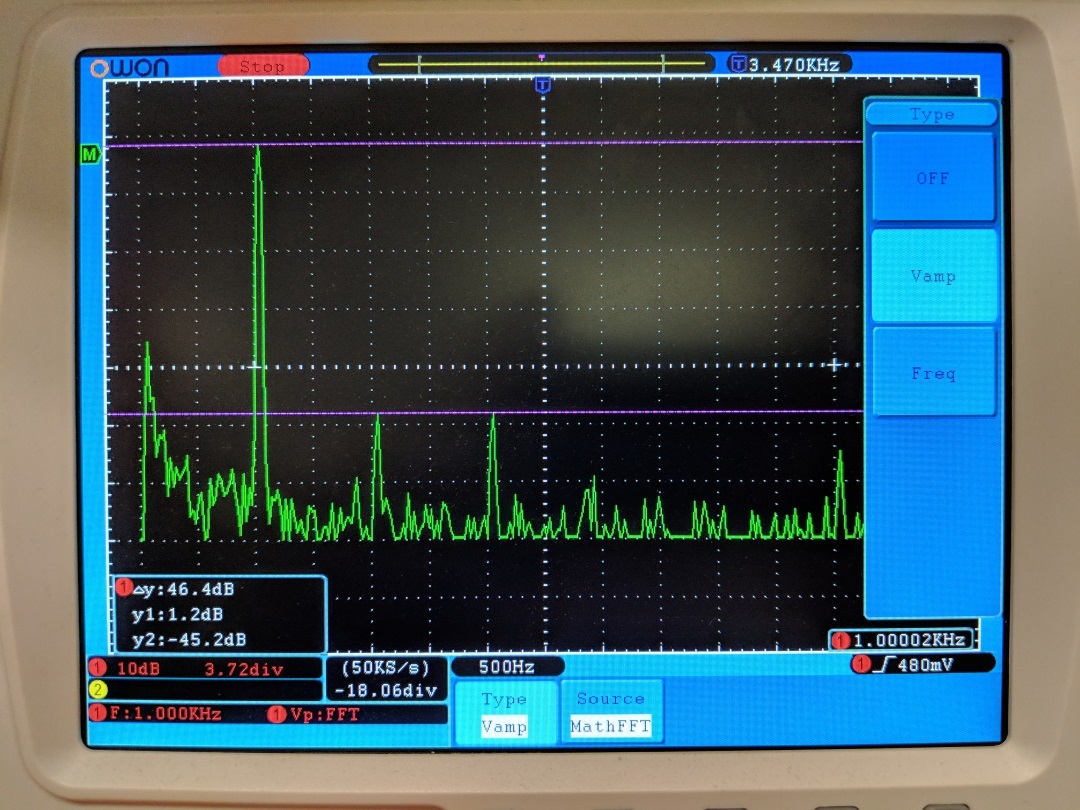
Audio DAC B FFT of the 1kHz sine wave
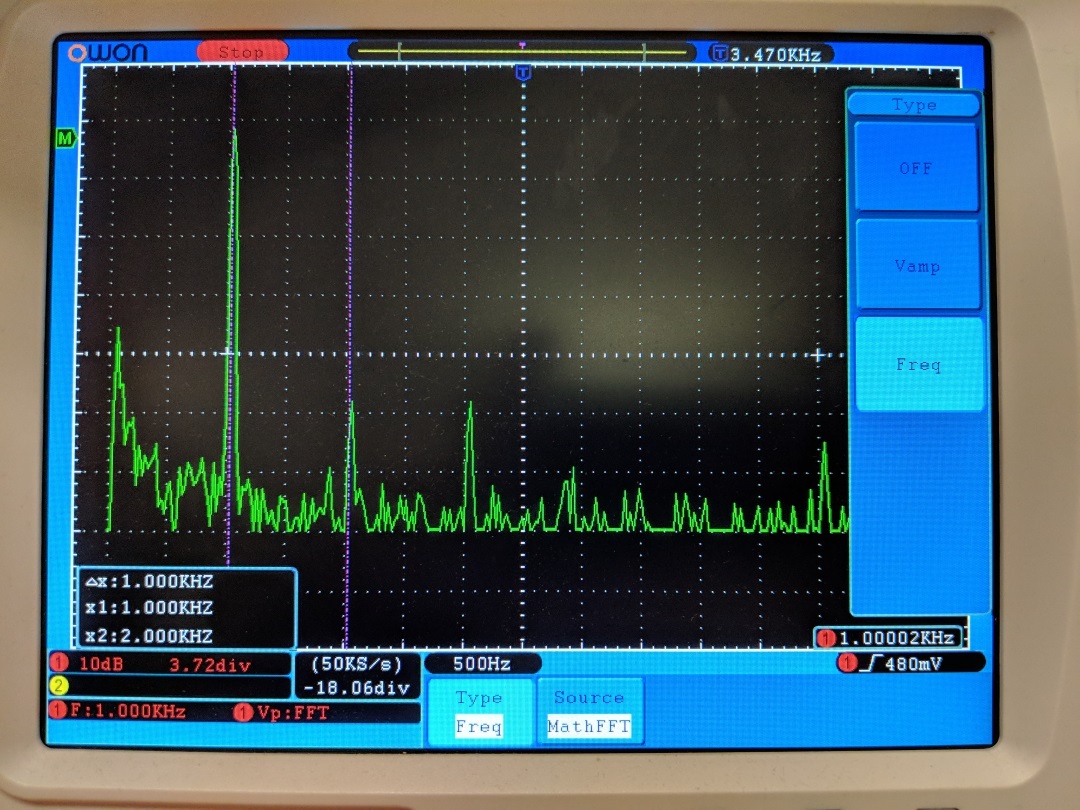
Audio DAC C FFT of the 1kHz sine wave
Using the built in FFT function on the oscilloscope I took a look at the spectrum of the 1kHz signal. Again nothing crazy. The primary frequency is at 1kHz as expected, and some harmonics at 2kHz and 3kHz. I then measured the amplitudes of the peaks to see if there was a difference.
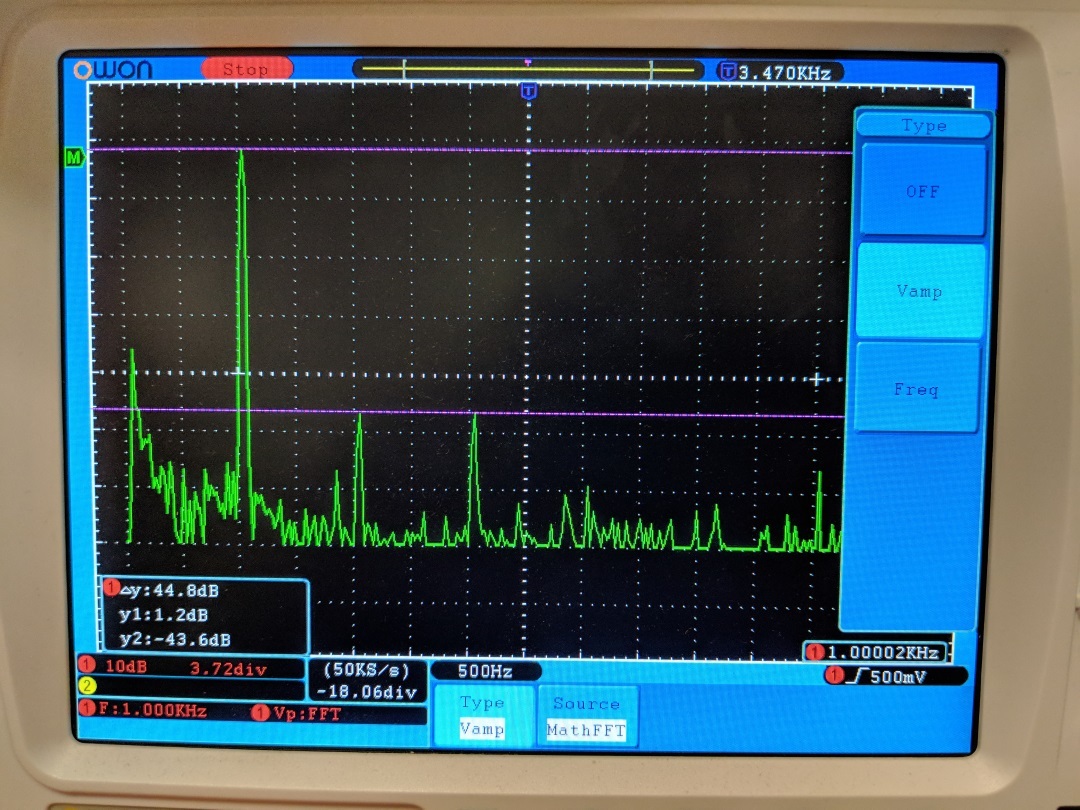
Audio DAC A amplitude measurements of the FFT of the 1kHz sine wave
Audio DAC B amplitude measurements of the FFT of the 1kHz sine wave
Audio DAC C amplitude measurements of the FFT of the 1kHz sine wave
The primary frequency amplitude is the same for all three DACs, but the harmonics have slightly different amplitudes. It seems that the ceramic capacitors do a better job at filtering out the harmonics compared to the film caps by a dB or so.
With the oscilloscope I was able to measure a slight difference between the three DACs, which is really cool. I was expecting to not be able to see a distinguishable difference but was happy to see something.
Line Input Results
I performed the exact same tests as I did on the oscilloscope with the line input on my computer’s sound card. I recorded the audio in with Audacity and ran the built in spectrum FFT analyzer that Audacity comes with.
Audio DAC A 1kHz FFT through sound card
Audio DAC B 1kHz FFT through sound card
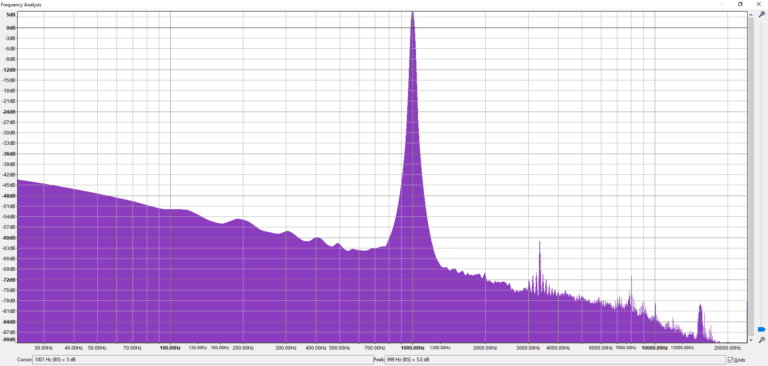
Audio DAC C 1kHz FFT through sound card
Interesting results through the sound card. The 2kHz harmonic seen on the oscilloscope is not there, but it does have the 3kHz harmonic. This harmonic is higher on DAC C which is the opposite of what was measured on the oscilloscope. Looking at this I assume the different input impedance loading on the DAC is having a greater affect on the signal than the passive parts have! Matching the input impedance is probably more important than which parts you choose, but lets keep going with the tests.

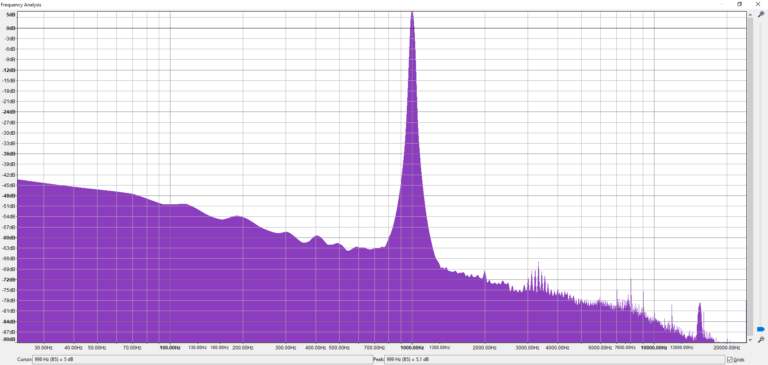
Audio DAC A 10Hz to 20kHz Sweep FFT through sound card
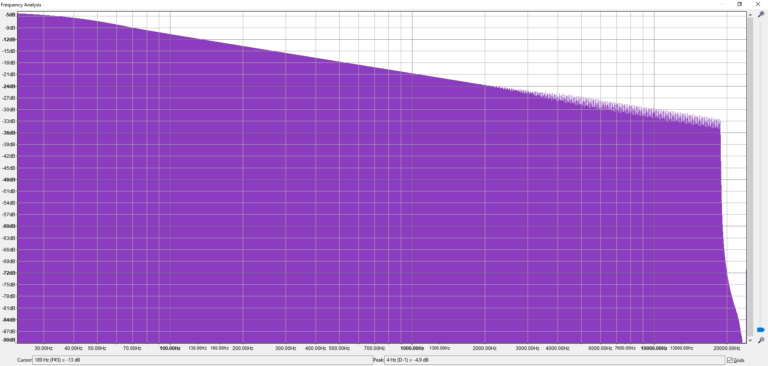
Audio DAC B 10Hz to 20kHz Sweep FFT through sound card

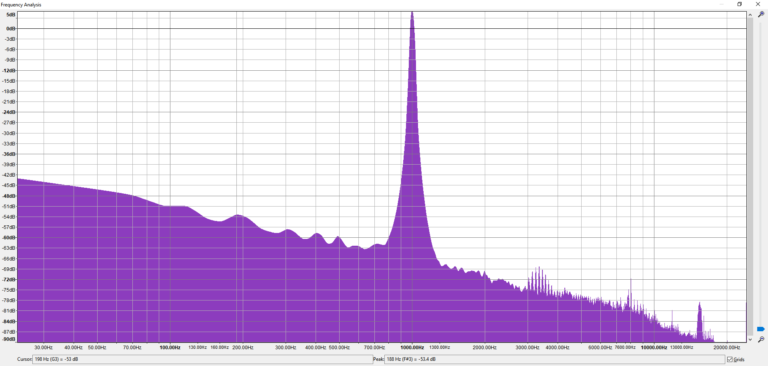
Audio DAC C 10Hz to 20kHz Sweep FFT through sound card
The next signal I sent the DACs was a 10Hz to 20kHz frequency sweep. I recorded the output then ran a FFT. Frequency response seems similar in shape across each Audio DAC. Since I had these saved as screenshots I decided to overlay the DAC A and DAC C graphs to see if there was anything else to gain from this.
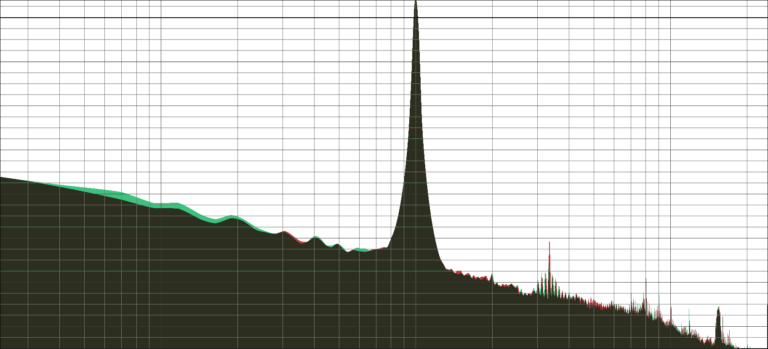
Audio DAC A (Green) overlayed on Audio DAC C (Red): 1kHz sine wave
In the low end frequencies, DAC A has a higher response overall. At 3kHz we can see the harmonic that DAC C has that is much stronger. Shapes are still very similar.
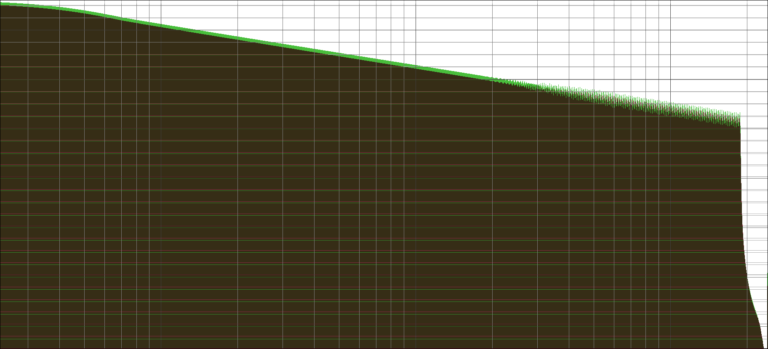
Audio DAC A (Green) overlayed on Audio DAC C (Red): 10Hz to 20kHz Sweep
In the frequency response sweep we see that DAC A has a higher response overall at any given frequency. We observed this possibility in the oscilloscope measurements where DAC A and DAC B had higher peak voltages than DAC C for the 1kHz signal.
Audio Listening Test
I was able to measure a difference between the three Audio DACs, but would a person be able to hear a difference between them? A blind audio listening test was needed. I decided to only test DAC A and DAC C to help speed up the test process. I put the Raspberry Pis and Audio DACs into a Corrugated Cardboard Case with the Audio Jack exposed and the power cable hanging out.
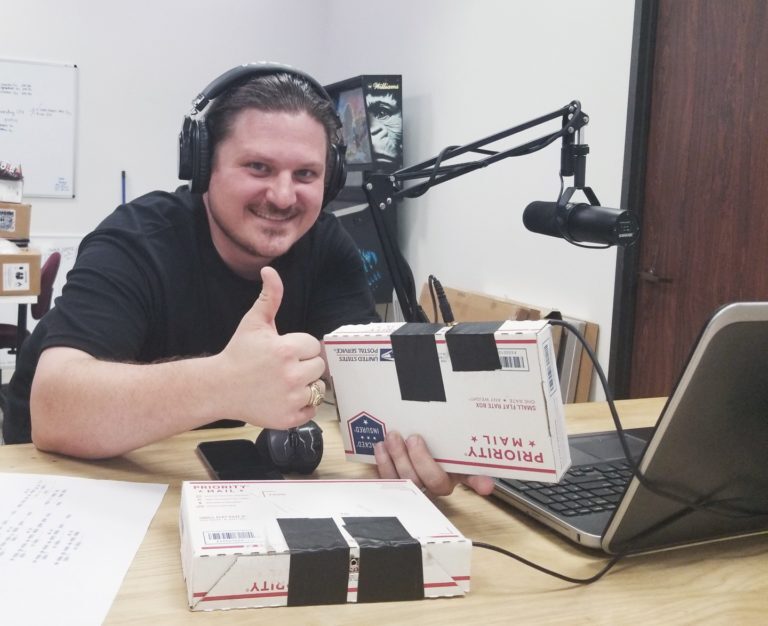
Stephen performing the blind audio test live on the podcast. He picked Audio DAC C.
I then had the raspberry pis play music. Since I wanted to use the best possible audio source I chose a FLAC copy of Dire Straits – So Far Away. Since DAC A has a higher amplitude response compared to DAC C I bumped the software volume on DAC C to make the amplitude match that of DAC A.
The two DACs were placed next to each other. The tester would then listen to the audio through headphones. Swapping to the other DAC was done by unplugging and swapping the headphones over. This was not an ideal test setup but it seemed to yield results.
Out of a sample size of 15 testers, 3 picked DAC A and 12 picked DAC C. Notes from some of the testers said that DAC A had slightly more bass, but DAC C sounded more “dynamic” or “open”. This is possibly a result from DAC A having more low end frequency response given a specific frequency.
Recap
With the listening test favoring DAC C and with DAC C costing less to manufacture I will be moving forward with the DAC C design and part load out. What I have taken away from this testing is that the impedance loading on the PCM5122 DAC (and probably most DACs and amplifiers) have a bigger impact on the signal quality then the passive parts around the said DAC. Both DAC designs sound very close to each other and would be acceptable in the environment (pinball machine) they will be used in.
The next step is to get the DAC C design ready for production by modifying the design to add pogo pin contacts. The pogo pin contacts will let me design a fixture similar to the one I built for this article and speed up the test procedure.
Was this post helpful? Have other questions? Let us know in the comments below.
Ready to get started?